Balance Sheet
(Unit : KRW 1 Million)
| Account | 2024.12.31 | 2023.12.31 |
|---|---|---|
| Total Asset | 95,967 | 72,291 |
| Cash and Aash equivalent | 27,724 | 21,727 |
| Other Financial Assets | - | - |
| Financial Assets Measured at FVPL | 50,597 | 29,139 |
| Financial Assets Measured at FVOCI | 1,217 | 1,203 |
| Financial Assets Measured at AC | 10,675 | 10,306 |
| Investments in Subsidiaries and Associates |
1,402 | 3,899 |
| Property and Equipment | 1,967 | 3,275 |
| Intangible Asset | 1,029 | 1,252 |
| Other Assets | 768 | 599 |
| Deferred Tax Assets | 588 | 890 |
| Total Liabilities | 26,783 | 9,573 |
| Other Liabilities | 25,889 | 7,831 |
| Current Tax Liabilities | 751 | 1,678 |
| Defined Benefit Liabilities | 75 | 64 |
| Total Equity | 69,184 | 62,718 |
| I. Equity Attributable to Shareholders of the parent company | 69,184 | 62,718 |
Capital Stock |
34,408 | 34,408 |
Capital Surplus |
2,327 | 2,327 |
Accumulated Other |
408 | 398 |
Retained Earnings |
32,041 | 25,585 |
| II. Non-controlling Interests | - | - |
Profit & Loss Statement
(Unit : KRW 1 Million)
| Account | 2024.01.01~ 2024.12.31 |
2023.01.01~ 2023.12.31 |
|---|---|---|
| Operating Revenues | 50,961 | 27,531 |
| Operating Expenses | 43,625 | 21,279 |
| Operating Income | 7,336 | 6,252 |
| Non-Operating Revenues | 379 | 1,322 |
| Non-Operating Expenses | 194 | 81 |
| Profit before Income Tax Expenses | 7,521 | 7,493 |
| Income Tax Expense | 1,634 | 1,685 |
| Net Income for the Year | 5,887 | 5,808 |
Shareholders of the parent |
5,887 | 5,808 |
Non-controlling Interests |
- | - |
| Other Comprehensive Income | 579 | (119) |
| Total Comprehensive Income for the Year |
6,466 | 5,689 |
Shareholders of the parent |
6,466 | 5,689 |
Non-controlling Interests |
- | - |
(Unit : KRW 100 Million)
- Asset Management(2024.12.31)
- ₩ 110,088
Asset Management
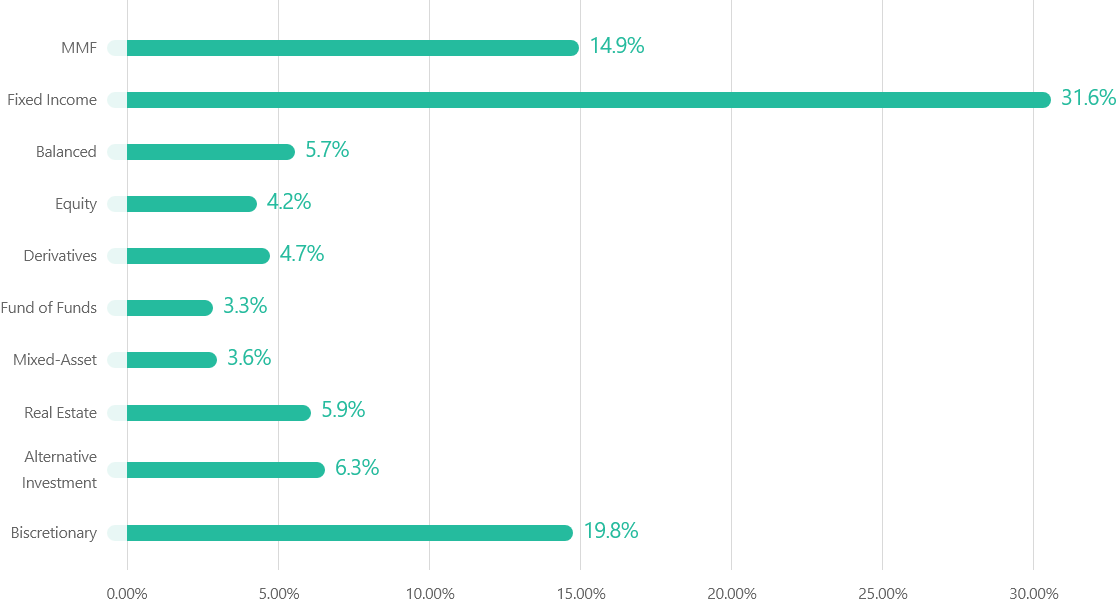
(Unit : KRW 100 Million)
| Type | 2024.12.31 | 2023.12.31 | Variation | Percentages |
|---|---|---|---|---|
| MMF | 16,361 | 21,114 | -4,753 | 14.9% |
| Fixed Income | 34,804 | 31,205 | 3,599 | 31.6% |
| Balanced | 6,282 | 3,012 | 3,270 | 5.7% |
| Equity | 4,601 | 4,406 | 195 | 4.2% |
| Derivatives | 5,140 | 4,224 | 916 | 4.7% |
| Fund of Funds | 3,667 | 4,014 | -347 | 3.3% |
| Mixed – Asset | 3,964 | 1,399 | 2,565 | 3.6% |
| Real Estate | 6,535 | 7,675 | -1,140 | 5.9% |
| Alternative Investment | 6,925 | 7,955 | -1,030 | 6.3% |
| Discretionary | 21,809 | 21,569 | 240 | 19.8% |
| Total AUM | 110,088 | 106,573 | 3,515 | 100.0% |
Percentages
(Base Date : Dec. 31. 2024)